When learning data analytics or statistics, the term confidence interval often sounds complicated. In reality, it is a simple and powerful concept that helps us understand how reliable our data results are. This guide will explain what confidence intervals mean, why they matter, and how you can interpret them with confidence.
If you want to explore these concepts in a structured and hands-on way, consider enrolling in a Data Analyst Course in Trivandrum at FITA Academy, where expert trainers help you master statistical analysis and real-world data techniques.
What is a Confidence Interval?
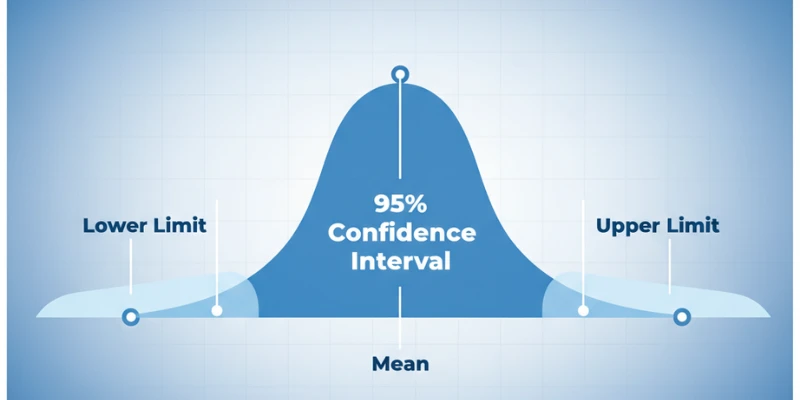
A confidence interval represents a set of values that is probably going to encompass the actual population value you aim to estimate. Instead of giving one exact number, a confidence interval gives a range that shows how uncertain or confident you are about your estimate.
For example, imagine you surveyed a group of people to find the average number of hours they spend online each day. If your sample shows an average of 4 hours with a 95% confidence interval of 3.5 to 4.5 hours, it means you can be 95% confident that the true average for the entire population lies between those two numbers.
Why Confidence Intervals are Important
Confidence intervals are an essential part of data analytics and statistical analysis because they show how precise your results are. When you only use a single number, it may not reflect the uncertainty in your data. By using a confidence interval, you communicate the reliability of your findings. Take your skills to the next level by joining a Data Analytics Course in Kochi, where you can practice these concepts with real-world datasets.
In business or research, this helps decision-makers understand the level of risk in their conclusions. For instance, if a marketing team estimates that a campaign will increase sales by 10% with a wide confidence interval, it signals more uncertainty than a narrow one. Tighter ranges typically suggest more dependable outcomes, often attributable to greater sample sizes or reduced variability in the data.
How to Interpret Confidence Levels
The most common confidence levels are 90%, 95%, and 99%. A 95% confidence interval means that if you repeated your study many times, about 95 out of 100 of those intervals would contain the true population value.
It does not mean that there is a 95% chance your interval is correct in one particular study, but that your method is 95% reliable in the long run. Enhance your understanding of confidence intervals and other key statistical concepts by joining a Data Analyst Course in Pune, where practical learning meets expert guidance.
Choosing a higher confidence level, such as 99%, gives you more certainty, but it also produces a wider range. This trade-off between confidence and precision is an important concept to remember.
Factors That Affect Confidence Intervals
Various elements affect the breadth of a confidence interval. Sample size plays a big role: larger samples lead to narrower intervals because they better represent the population. Variation in data also matters. When your data values are very spread out, your interval will be wider. Finally, the chosen confidence level affects the range; higher confidence levels produce wider intervals since you want to capture the true value more surely.
Confidence intervals are a key concept for beginners in data analytics because they provide a clear way to express uncertainty in data. Instead of focusing on a single estimate, they help us understand the possible range for the true value.
Whether you are analyzing survey results, business performance, or scientific data, confidence intervals guide better, more informed decisions. Mastering this concept builds a strong foundation for deeper statistical analysis in your data journey. Take your learning further by enrolling in a Data Analyst Course in Jaipur, where hands-on training and expert guidance help you apply these concepts in real-world scenarios.
Also check: Anomaly Detection Techniques in Business Data